Produced by the University of Michigan Center for the History of Medicine and Michigan Publishing, University of Michigan Library
Influenza Encyclopedia
The American Influenza Epidemic of 1918-1919:
A Digital Encyclopedia
Toledo, Ohio
50 U.S. Cities & Their Stories
On September 18, Toledo Health Commissioner Dr. C. W. Waggoner warned residents that influenza would likely soon arrive in the city from the East Coast. In fact, the previous day Toledo newspapers reported that some residents had already fallen ill with mild cases of influenza, but that no deaths had yet resulted from it. Health Commissioner Waggoner advised residents to use the strictest caution in avoiding crowds, and to seek out a physician if they started to feel ill or develop cold-like symptoms. Influenza was made a reportable disease, and cases and family members were to be placed under home quarantine. Waggoner sternly told physicians that he expected them to report all cases promptly so that the Division of Health could take action and better monitor the development of the impending epidemic in the city. Toledo braced itself for what was to come.1
School officials were quick to take the threat of the epidemic seriously. In the first days of October, the head school physician, Dr. Ralph Stewart, announced that three physicians and five school nurses would screen students for influenza during their regular diphtheria screening. Any student absent for more than a day would be visited at home by nurses, who would assess their health and provide health care information to the family. With such measures in place and with the relatively few cases in the city thus far, Dr. Stewart felt no need to closing schools at present time.2
Toledo officials were not yet worried about a possible epidemic. Waggoner believed that the disease making its way across the nation was the same type of influenza that had attacked the country in 1888-89 and had been circulating among the population since then. He saw no reason why Toledo would experience a deadly epidemic. “The public should not be alarmed,” he said. “We have this trouble with us all the time, in a fewer number of cases, of course…What we have is nothing but an influenza of a very mild type.” Mayor Cornell Schreiber told residents that the city would close public places if it became necessary, “but any alarm is without basis at this time.”3 Only twenty influenza cases had been reported for all of September, compared to 23 for the previous September, and none of these had resulted in death.4
Because Waggoner and Mayor Cornell Schreiber considered the strain of influenza mild and likely to leave Toledo largely unscathed, they focused on the caring for the sick rather than enforced social distancing for the entire population. In other cities, officials, sometimes in concert with local stakeholders, tended to think immediately in terms of closure orders, staggered business hours, ventilation and crowd control on mass transit, and public gathering bans. In Toledo, by contrast, early control of the city’s public health measures was handed over to the local chapter of the Red Cross. On Tuesday, October 8, the city council gave the Red Cross full control of epidemic planning measures so that it could better coordinate medical and nursing resources. A committee of Red Cross officials was named to conduct a survey of Toledo’s residents to determine exactly how many nurses were available as well as to enlist every possible volunteer. Practical nurses had thus far responded in large numbers, but lay residents were as yet hesitant to lend their services in making beds, cooking meals, or providing supplies. Waggoner still believed that Toledo would be spared a severe epidemic, but felt that if such a scourge were to visit the city, the Red Cross could meet the disease with an army of nurses and volunteers.5
Two days later, on October 10, the Ohio Board of Health issued its closure recommendations.6 Official notice had not yet been received in Toledo, so Waggoner, Mayor Schreiber, and the Mayor’s cabinet met to decide what action to take for the time being, ultimately deciding to cancel only “all unusual assemblages” in Toledo, including Liberty Loan meetings, the parade, and sailors’ dances. Public funerals were allowed, as Waggoner correctly believed that there was no danger of infection or contagion from an embalmed body. What he failed to consider was the danger posed by large numbers of people congregating at such an event, or at theaters, movie houses, or other such places.7
On October 13, Mayor Schreiber received notice of the state closure recommendations from the capital. Consulting with his advisors and Waggoner, he issued sweeping closure orders for Toledo, effective at midnight the next day. All public places–saloons, theaters, churches, public libraries, poolrooms, theaters, movie houses, dance halls, and soda fountains-were ordered closed and all indoor and outdoor public gatherings forbidden. Mercantile establishments could remain open only from 9:00 am to 4:00 pm in order to prevent congestion on streetcars. Public funerals were prohibited. The city’s 50,000 schoolchildren received an unexpected holiday, as both public and parochial schools across Toledo were closed. Schreiber and Waggoner billed the closure order and gathering ban as a preventive measure, telling residents that there was no cause for alarm and that the number of cases that had visited the city thus far was small and of a mild nature.8 Whether or not they believed this, Toledo residents hunkered down for a long–and decidedly less entertainment-filled–winter.
Despite the growing epidemic across the nation, in Ohio, and even in Toledo, Waggoner was still optimistic that the worst had passed. Only a day after the closure order had gone into effect, he told the city’s newspapers that he believed the epidemic had crested and that the bans might be lifted in as little as ten days. Little did he know that Toledo’s epidemic had only just begun, and in those ten days the number of influenza-related deaths would increase nearly threefold. Others were less upbeat. The Toledo News-Bee reported that it was an open secret that the city had as many as 10,000 cases of influenza, but that Waggoner and the Division of Health had pared that number down to only half that.9
Owners of Toledo’s four hundred saloons were not pleased with the closure order. At least they could not complain of unfair treatment: no place in the city was allowed to sell liquor, including bars attached to wholesale stores and hotels. But Mayor Schreiber’s order only extended to the city limits, and could not prevent saloons in the countryside from remaining open. And they did, drawing business from city residents with a thirst for alcohol and the means to get outside the city. The county sheriff’s office said it would do its best to keep crowds from forming in the local bars and saloons, but there was no such legal requirement. Upset with the situation, one Toledo saloon keeper said that, as he had a state-issued license and the state authorities had not required saloons to close, he would keep his doors open.10 One resident, also upset that saloons were closed, obtained a prescription –written in Latin–for eight ounces of “spirits fermenti.” When he could find no druggist who could either read Latin or was willing to help him, he turned to Schreiber (who could read Latin) for assistance. Reading the man’s prescription and realizing it was for whisky, the Mayor declined.11
Saloon owners were not the only ones who complained about the orders. Retailers were also unhappy with their newly restricted business hours. First, there was confusion when some grocery stores opened in the early morning that first day while others–sometimes across the street–waited until 9 am, believing they had to abide by the restricted business hours. Mayor Schreiber quickly clarified the ruling: the order was universal, and would apply equally to all shops and stores except drugstores and stores that distribute city newspapers, which were allowed to sell newspapers at other hours provided they sold nothing else. Schreiber had initially intended the restricted hours only to apply to downtown businesses, but extended it to all city stores to avoid unfairness. Retailers seemed appeased, claimed that the new hours were satisfactory, and pledged to abide by them. Representatives from the streetcar company, Rail-Light, likewise promised to do their best to keep trains well ventilated and free from crowding.12
While city institutions and businesses vowed to comply with the order, albeit with perhaps a bit of grumbling, rural businesses took every advantage of the situation. Lucas County Sheriff Robert Gardner protested against the “full blast” conditions in the countryside, which, because it was not subject to the bans, was attracting joyriders. His office had received over one hundred complaints already. Influenza was reported to be on the rise in the area, and many considered the rural region to be a menace to Toledo. Sheriff Gardner suggested that the county commissioners grant him the authority to maintain a “quarantine”–by which he meant an enforced social gathering ban similar to Toledo’s–throughout the county. The commissioners refused, citing that each of the thirteen Lucas County townships had their own health officers and legal jurisdiction over township health codes and orders. With Toledo authorities upset and with growing epidemics of their own, several townships enacted their own bans. In Adams Township, authorities closed all places of public gathering and amusement. In Washington Township, a closure order for the town and for all areas within a 20-mile radius was imposed. Authorities there spread the word that Toledo partygoers in their township would be dispersed. Maumee, adjacent to Toledo, closed its saloons to prevent Toledoans from seeking liquid entertainment there.13
Although more and more county watering holes were being closed, crafty Toledo residents could still find open saloons with just a bit of hunting. “These sneaking saloonists,” Safety Director Chris Wall announced, “who have more interest in copping an extra nickel than they have in assisting in the work of safeguarding the lives of our people, are might cheap.” He vowed not only to catch these saloon owners, but to make a public show of arresting them by hauling proprietors and patrons away in the paddy wagon.14 Stopping violators was important, as it not only prevented unnecessary public gathering but also made it clear that scofflaws would not be allowed to gain an unfair advantage. To saloon owners who thought their trade was being singled-out, Wall said, “This isn’t a fight on liquor men, nor their businesses. It applies to schools and churches, which have closed, and is for the general good.”15
On October 22, Heath Commissioner Waggoner announced that Toledo’s epidemic had reached its crest, and that while the death rate would likely continue to climb in the short term, the number of new cases would begin to decline.16 Despite strong pressure to lift the closure order, Waggoner insisted that it be kept in place until the threat of danger had completely passed. He did make a concession to some retailers, however, extending store hours until 7:00 pm on Saturdays, a busy shopping day. Tobacconists were allowed to remain open until 6:00 pm, provided customers did not linger after making their purchases. These small moves probably helped relieve congestion in downtown stores, which, according to the county prosecutor, had been heavily crowded as a result of the shorter hours.17
By the end of October, Mayor Schreiber and Health Commissioner Waggoner were ready to begin lifting the closure order and gathering ban, planning on doing so gradually. State authorities in Columbus, however, strongly urged Toledo to continue with the bans, stating that this was the express wish of United States Surgeon General Rupert Blue and the Public Health Service.18 A few days later, however, on October 31, the state approved the lifting of influenza control measures in communities where the danger of the epidemic had passed.19 Schreiber immediately allowed churches to re-open for regular Sunday services. The next day, Schreiber and Waggoner ordered a quick but staged lifting of the closure order. Starting on Monday, November 4, all places were allowed to open from 9:00 am to 4:30 pm, except theaters, billiard and pool halls, and libraries. Theaters could re-open on Thursday, November 7, conditional on them closing for at least one hour per day between the afternoon and evening shows for cleaning and ventilation. This condition would be removed on November 10. Schools were to remain closed for an additional week, opening on Monday, November 11. Announcing the re-opening plan, Schreiber thanked residents and business owners “for their earnest cooperation and self sacrifice in this great emergency.” Toledo readied itself for a return to normal life.20
When the city’s entertainment venues did open, they found large crowds eagerly waiting to spend their money on fun. Theaters were packed. Saloons had patrons bellying up to the bar before sunrise. Movie houses were filled before noon. People even thronged the city’s libraries and art museum.21 For drinkers, the revelry was interrupted on November 11, when Mayor Schreiber, by request of the State Liquor Commission, ordered all city saloons temporarily closed at noon on account of Armistice Day. The fear was “a riotous Monday night celebration” that could quickly get out of hand if saloons remained open.22
The rest of November rolled on with no major resurgence of the epidemic. By the first days of December, however, it became clear that children were falling ill in startling numbers. School and health officials watched the situation intently, ready to close schools at any moment should it become necessary. On December 10, Health Commissioner Waggoner met with the city’s welfare director and the Superintendent of Schools William B. Guitteau and decided that the situation among children had become serious enough–over 5,000 of Toledo’s 32,000 school children were absent–to warrant a second school closure order. Starting the next day, all public, parochial, and Sunday schools were to be closed until at least January 2, 1919. All children under 18 were banned from theaters, movie houses, libraries, art museums, dances, parties, and all other forms of public gatherings. Parents were asked to leave their children at home while doing their holiday shopping, and merchants were told to keep their shops clear of children.23 Controlling influenza among the city’s children was not the only concern of health officials; an incipient epidemic of diphtheria had also broken out at one Toledo school, and authorities hoped that it could be brought under control before that disease spread throughout the city as well.24 Waggoner and school officials called on teachers to conduct home visits, but the plan was met with strong opposition from teachers who claimed that entering the homes of the ill would expose them to illness and would only help to spread the disease.25 As in nearly every other school district in the nation, there was no legal way to compel teachers to work in any other capacity except teaching.
Toledo’s children finally returned to school on Monday, January 6. The ban on youngsters entering public places had been lifted a week earlier, on December 30, in time for New Year’s Eve celebrations. With these two steps, Toledo’s last remaining anti-epidemic measures were removed. Over the course of January and well into February, the city continued to experience cases of influenza, although not nearly in the same numbers as in October.
By all measures Toledo did quite well during the epidemic. Unlike other major Ohio cities, which began experiencing noticeable numbers of influenza cases by the week of October 5, Toledo’s epidemic did not begin until the week of October 12. This extra week gave the city time to gather additional nurses, who not only provided care to the ill, but actively quarantined thousands of Toledo homes. Although not widely reported in the city’s newspapers, some 8,361 homes were quarantined in the fall of 1918.26 Toledo authorities placed so much emphasis on nursing that early epidemic planning was handed over to the local chapter of the Red Cross, at least until orders were received from Columbus to close places of public gathering. It is possible that Toledo’s epidemic got off to a slow start because of the special attention paid to mobilizing a large number of nurses. It is also possible that the quick order to quarantine removed enough contagious people from the circulating population to slow the early course of the epidemic. On the other hand, it is equally possible that Toledo was able to gather nurses because, for reasons unknown, the city’s epidemic was not as explosive as it was in other cities.
The Division of Health, claiming that over-taxed physicians likely under-reported cases, estimated that Toledo experienced 20,000 cases of influenza during the epidemic. The true figure was likely much lower, perhaps closer to half as many. In any event, 716 Toledoans died of either influenza or influenza-related pneumonia during that fall, a large number to be sure, but one much lower than in many other cities.27 Toledo’s total excess death rate [EDR] for the second and third waves of the epidemic (that is, September 1918 through February 1919) was only 295 people per 100,000 population. By comparison, for the same period, Dayton’s EDR was 410, Cincinnati’s was 451, and Cleveland’s was 474. Only Columbus came close to doing as well as Toledo, with an excess death rate of 312 per 100,000. Detroit, Michigan, only 60 miles to the north and a city that had much commercial, cultural, and social interaction with Toledo, had an EDR of 311 per 100,000 people.
Notes
1 “We Have With Us the Influenza,” Toledo News-Bee, 17 Sept. 1918, 1; “Health Officer Warns,” Toledo News-Bee, 18 Sept. 1918, 1; “Toledo Is Warned of Influenza,” Toledo News-Bee, 19 Sept. 1918, 17; “Begin Warfare on Influenza,” Toledo News-Bee, 23 Sept. 1918, 3.
2 “Take Steps to Prevent Flu,” Toledo Daily Blade, 3 Oct. 1918; “Will Mobilize Flu Fighters,” Toledo Daily Blade, 4 Oct. 1918.
3 “No Flu at Big Plant,” Toledo News-Bee, 7 Oct. 1918, 1.
4 “No Deaths Caused by Influenza,” Toledo News-Bee, 4 Oct. 1918, 2.
5 “No Epidemic Is Feared,” Toledo News-Bee, 8 Oct. 1918, 1.
6 The Ohio State Department of Health did not issue a mandatory statewide closure order, believing that local communities should be left free to adapt the general closure order recommendations to their needs. See “Controlling the Influenza Epidemic in Ohio,” The Ohio Public Health Journal 9 (Nov. 1918), 453-456.
7 “State Takes Action in Epidemic,” Toledo News-Bee, 11 Oct. 1918, 14; “Bond Parade and Party Is Cancelled–Influenza,” Toledo Daily Blade, 11 Oct. 1918; “Influenza Not Alarming,” Toledo News-Bee, 12 Oct. 1918, 1.
8 “Checking the Spread of Influenza,” Toledo City Journal (3:42), 1; “Mayor Acts to Halt Spread of Flu,” Toledo News-Bee, 14 Oct. 1918, 1.
9 “May Lift Order in 10 Days,” Toledo News-Bee, 15 Oct. 1918, 1.
10 “May Lift Order in 10 Days,” Toledo News-Bee, 15 Oct. 1918, 1.
11 “Officials Not Worried,” Toledo News-Bee, 16 Oct. 1918, 1.
12 “Says Flu Ban May Continue for Ten Days,” Toledo Daily Blade, 15 Oct. 1918.
13 “7 More Die, Quarantine for County,” Toledo Daily Blade, 17 Oct. 1918; “Flugrams,” Toledo News-Bee, 18 Oct. 1918, 2.
14 “Scourge Shows Increase,” Toledo News-Bee, 18 Oct. 1918, 1; “14 More Die; Flu Strikes the Miami Home,” Toledo Daily Blade, 18 Oct. 1918.
15 “570 More Cases Reported,” Toledo News-Bee, 19 Oct. 1918, 1.
16 “Thinks Crest of Flu Passed,” Toledo News-Bee, 22 Oct. 1918, 1.
17 “Closing Order to Stand,” Toledo News-Bee, 24 Oct. 1918, 1; “Extend Flu Hours for Cigar Stores,” Toledo News-Bee, 25 Oct. 1918, 1; “Twenty-Two Is Late Toll of Epidemic,” Toledo Daily Blade, 21 Oct. 1918.
18 “Don’t Lift Ban, US Orders,” Toledo News-Bee, 29 Oct. 1918, 1. In early-October, Blue had issued a circular to all public health departments in the nation informing them of the likelihood of epidemic influenza spreading across the United States and recommending public closure orders and gathering bans for the duration of the epidemic. See, for example, Blue to Minnesota State Health Officer, 6 Oct. 1918, Records of the Minnesota Department of Health, Correspondence and Miscellaneous Records, Box 4, Folder 32J, Minnesota State Historical Society, St. Paul, Minnesota.
19 Since the Ohio State Department of Health had not issued a mandatory statewide closure order, it did not need to give communities clearance to re-open their public places. However, the State Department of Health strongly discouraged the premature lifting of closure orders and gathering bans, and did its best to ensure that local authorities kept such measures in place until conditions in the region warranted their removal. See “Controlling the Influenza Epidemic in Ohio,” The Ohio Public Health Journal 9 (Nov. 1918), 453-456.
20 “Raises Ban for Churches,” Toledo Daily Blade, 31 Oct. 1918; “Flu Ban to End Thursday,” Toledo News-Bee, 1 Oct. 1918, 1.
21 “Influenza Ban Is Lifted,” Toledo News-Bee, 7 Nov. 1918, 2; “Death Rate for the Month Increased,” Toledo News-Bee, 8 Nov. 1918, 17.
22 “Saloons Are Closed at Noon,” Toledo News-Bee, 11 Nov. 1918, 1.
23 “Flu Ban Clamped on the Schools in Toledo; Business Is Not Affected,” Toledo News-Bee, 10 Dec. 1918, 1.
24 Toledo City Journal, Supplement: Division of Health Annual Report, 1918 (Toledo: 1919), 4.
25 “Oppose Order to Visit Homes,” Toledo News-Bee, 11 Dec. 1918, 1.
26 Toledo City Journal, Supplement: Division of Health Annual Report, 1918 (Toledo: 1919), 5.
27 Toledo City Journal, Supplement: Division of Health Annual Report, 1918 (Toledo: 1919), 5.
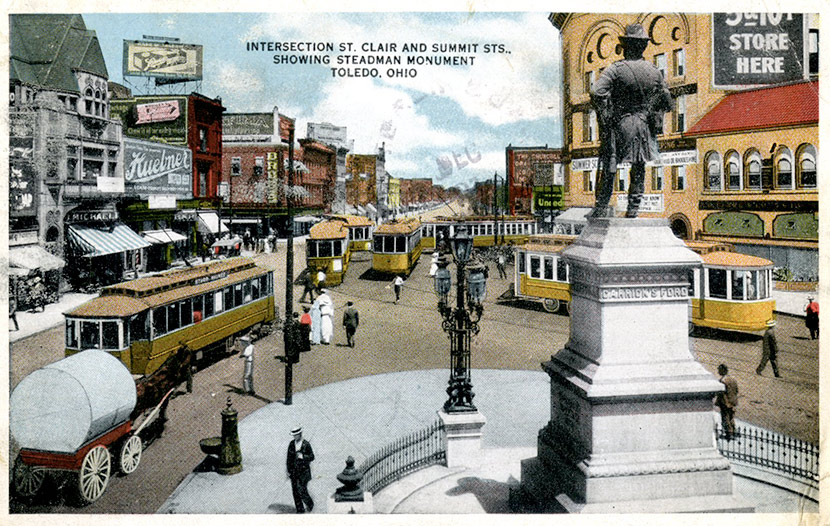
 Click on image for gallery.
The busy intersection of St. Clair and Summit Streets in downtown Toledo. Today, the Steadman Monument is gone, and St. Clair and Summit Streets no longer intersect.
Click on image for gallery.
The busy intersection of St. Clair and Summit Streets in downtown Toledo. Today, the Steadman Monument is gone, and St. Clair and Summit Streets no longer intersect.
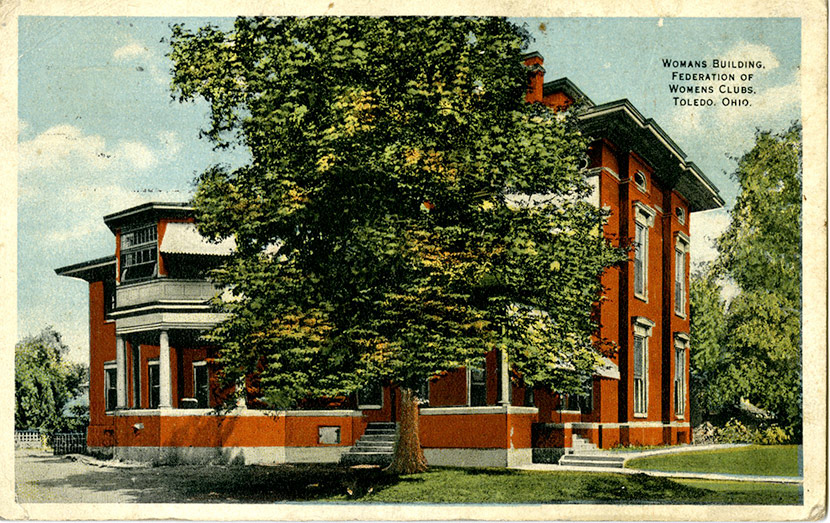
 Click on image for gallery.
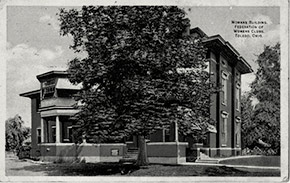
The Woman’s Building of the Federation of Women’s Clubs in Toledo. As in most cities, charitable and civic organizations such as this played a huge role in helping care for the sick during the epidemic.
Click on image for gallery.
The Woman’s Building of the Federation of Women’s Clubs in Toledo. As in most cities, charitable and civic organizations such as this played a huge role in helping care for the sick during the epidemic.
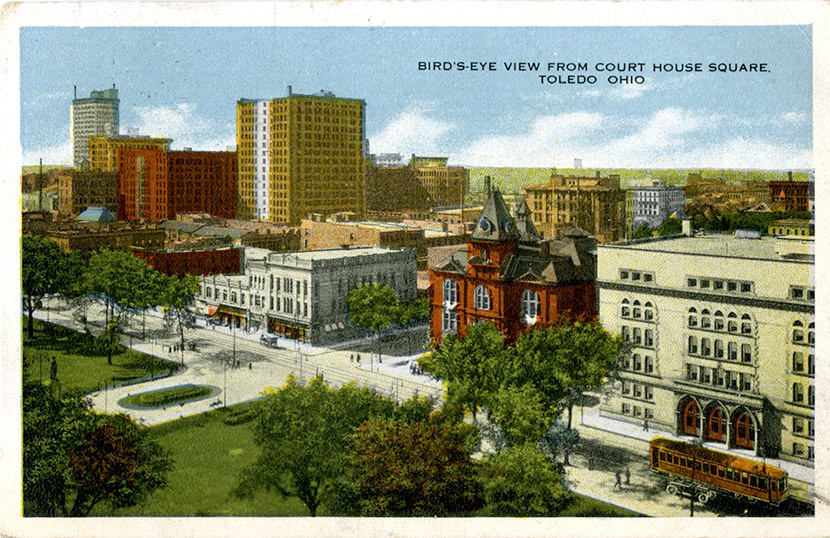
 Click on image for gallery.
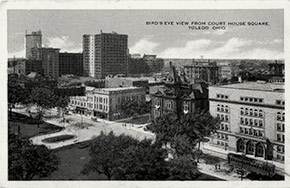
A bird’s-eye view of Toledo from Courthouse Square.
Click on image for gallery.
A bird’s-eye view of Toledo from Courthouse Square.
Document archive maintained by Michigan Publishing of the University of Michigan Library | Copyright statement.
For more information please contact mpub-help@umich.edu | Contact the Editors